Yale COVID Wastewater Tracker
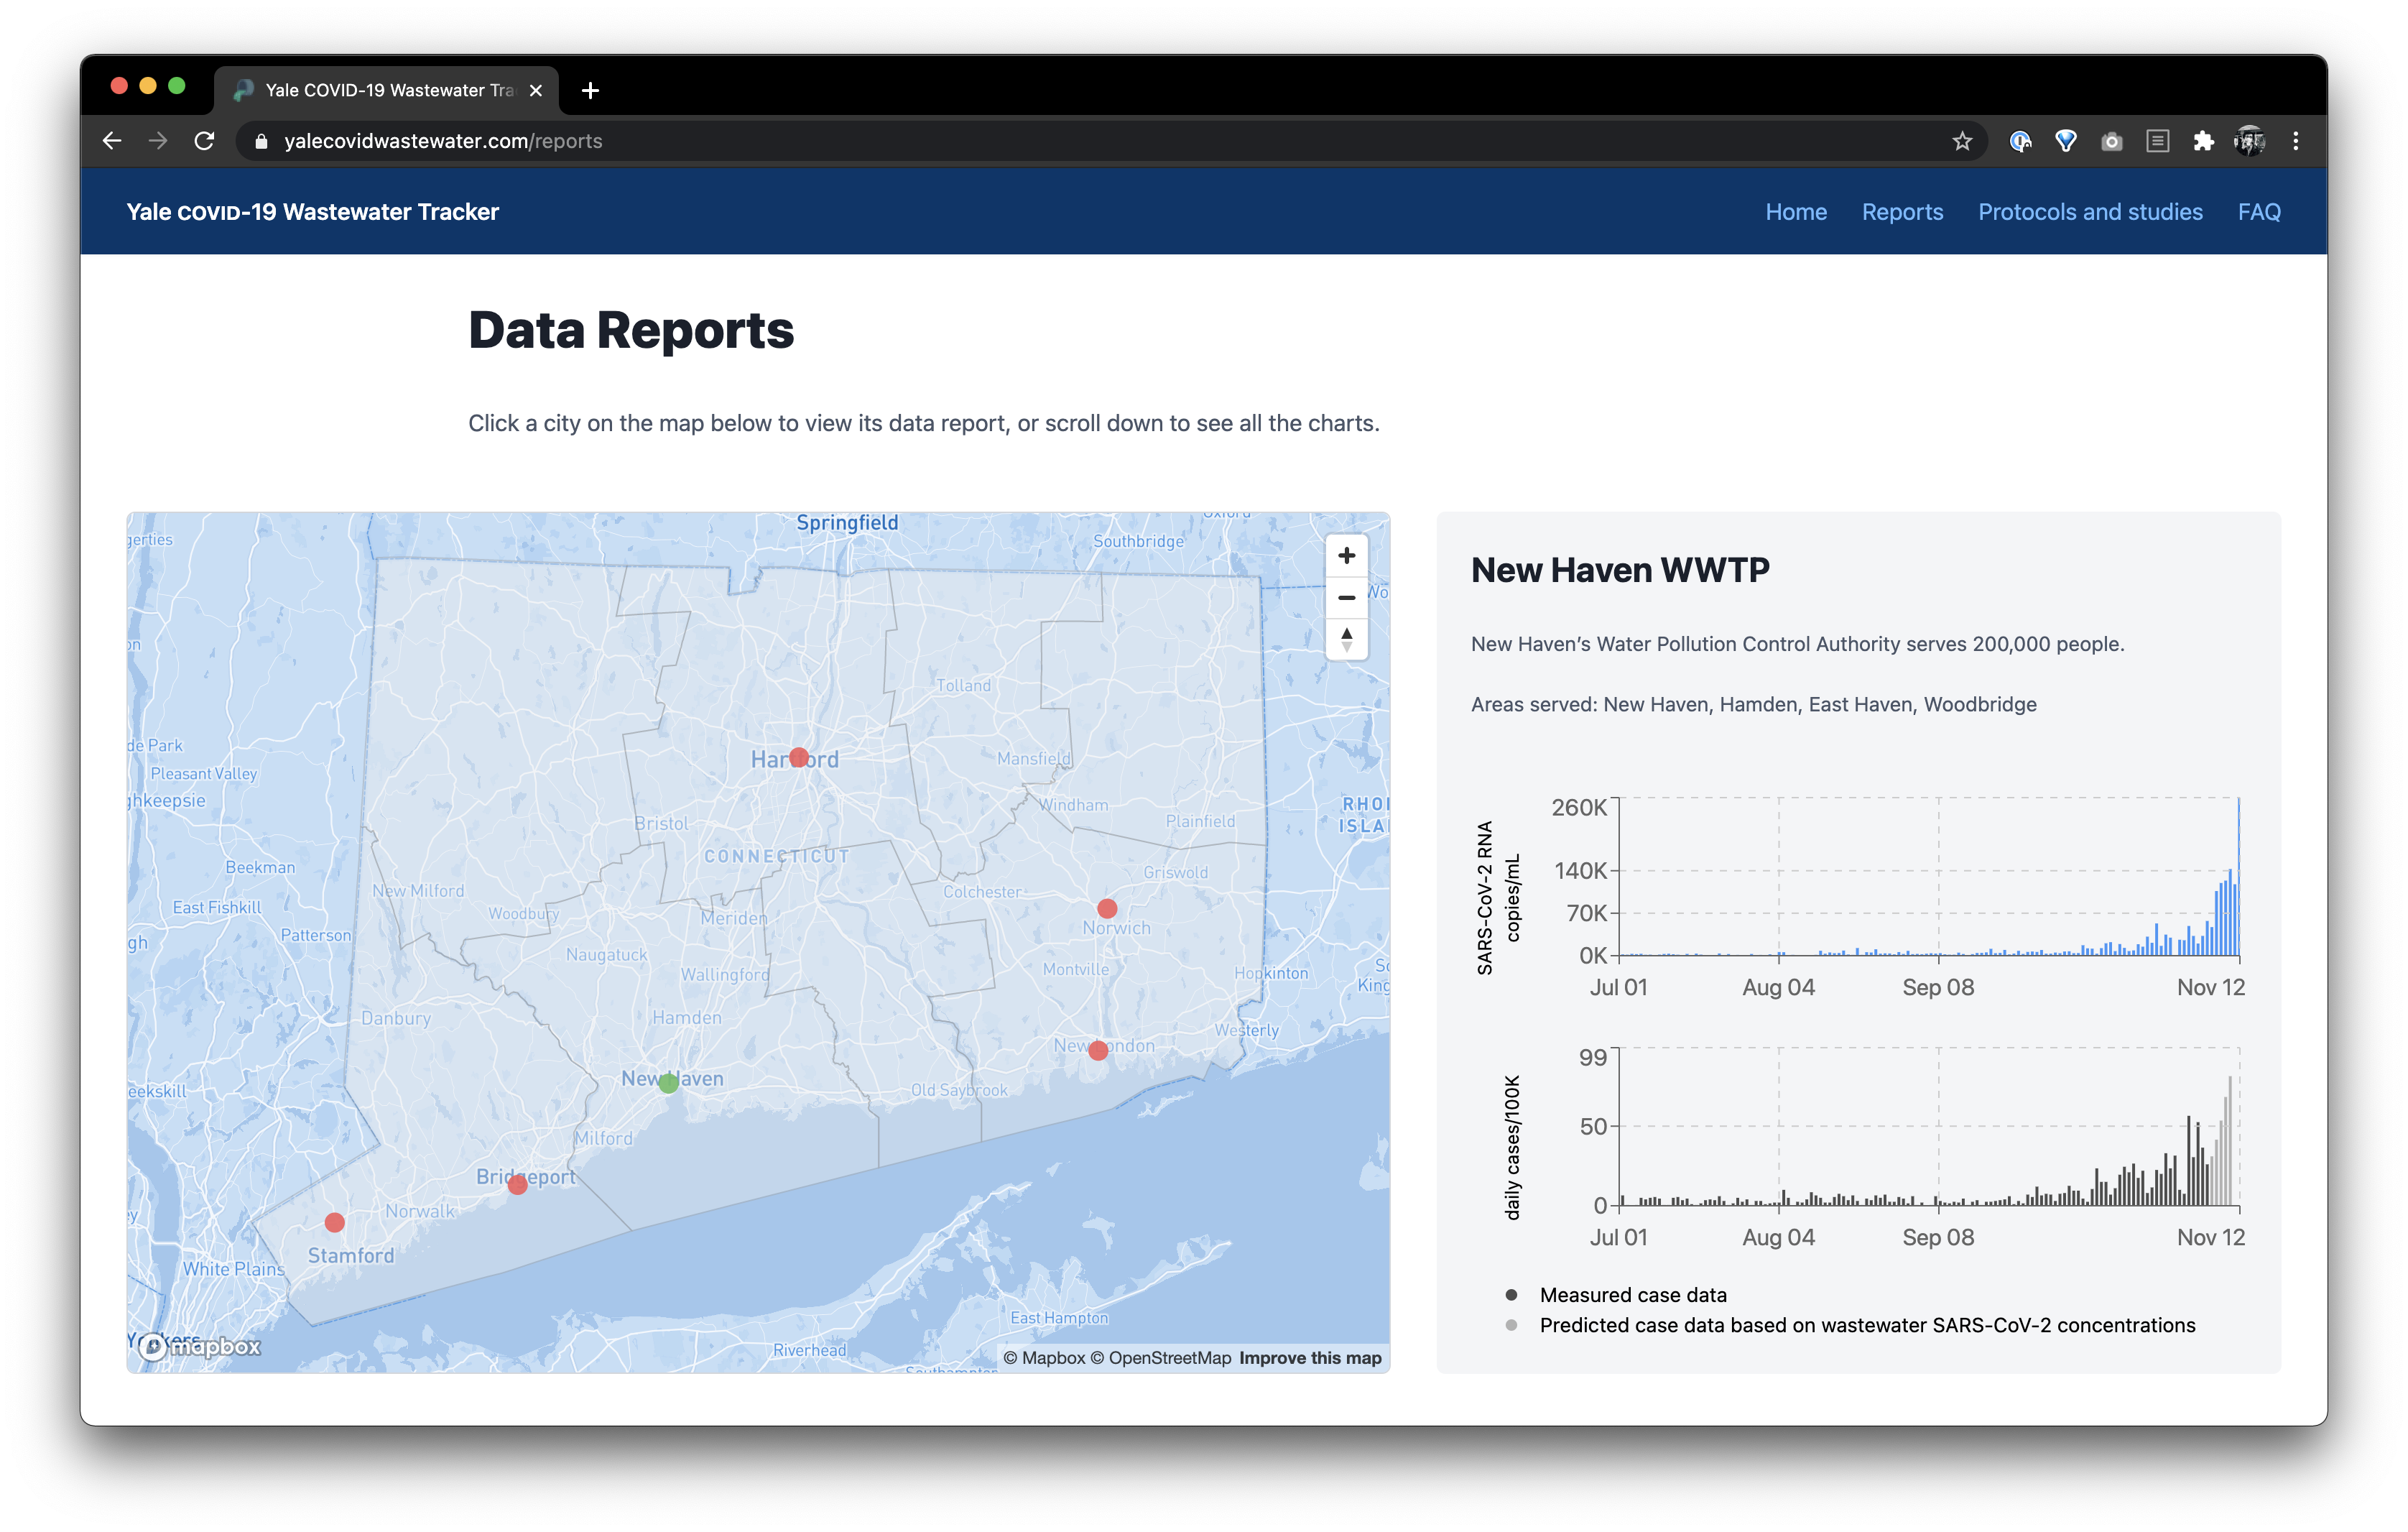
I worked with the Peccia Lab at Yale University to build the Yale COVID-19 Wastewater Tracker. In brief, the website visualizes RNA concentration of the SARS-CoV-2 virus in wastewater, collected near Connecticut treatment plants. A statistical model also predicts COVID-19 cases, sometimes up to a week ahead of official case numbers. The tracker is an invaluable tool for officials and the public to keep their fingers on the pulse of the state's health.
You can click the link above and read more about the lab's research and see the data. In this post, I will discuss the technologies used and give an overview of the technical challenges in building the website.
Table of contents
The major components
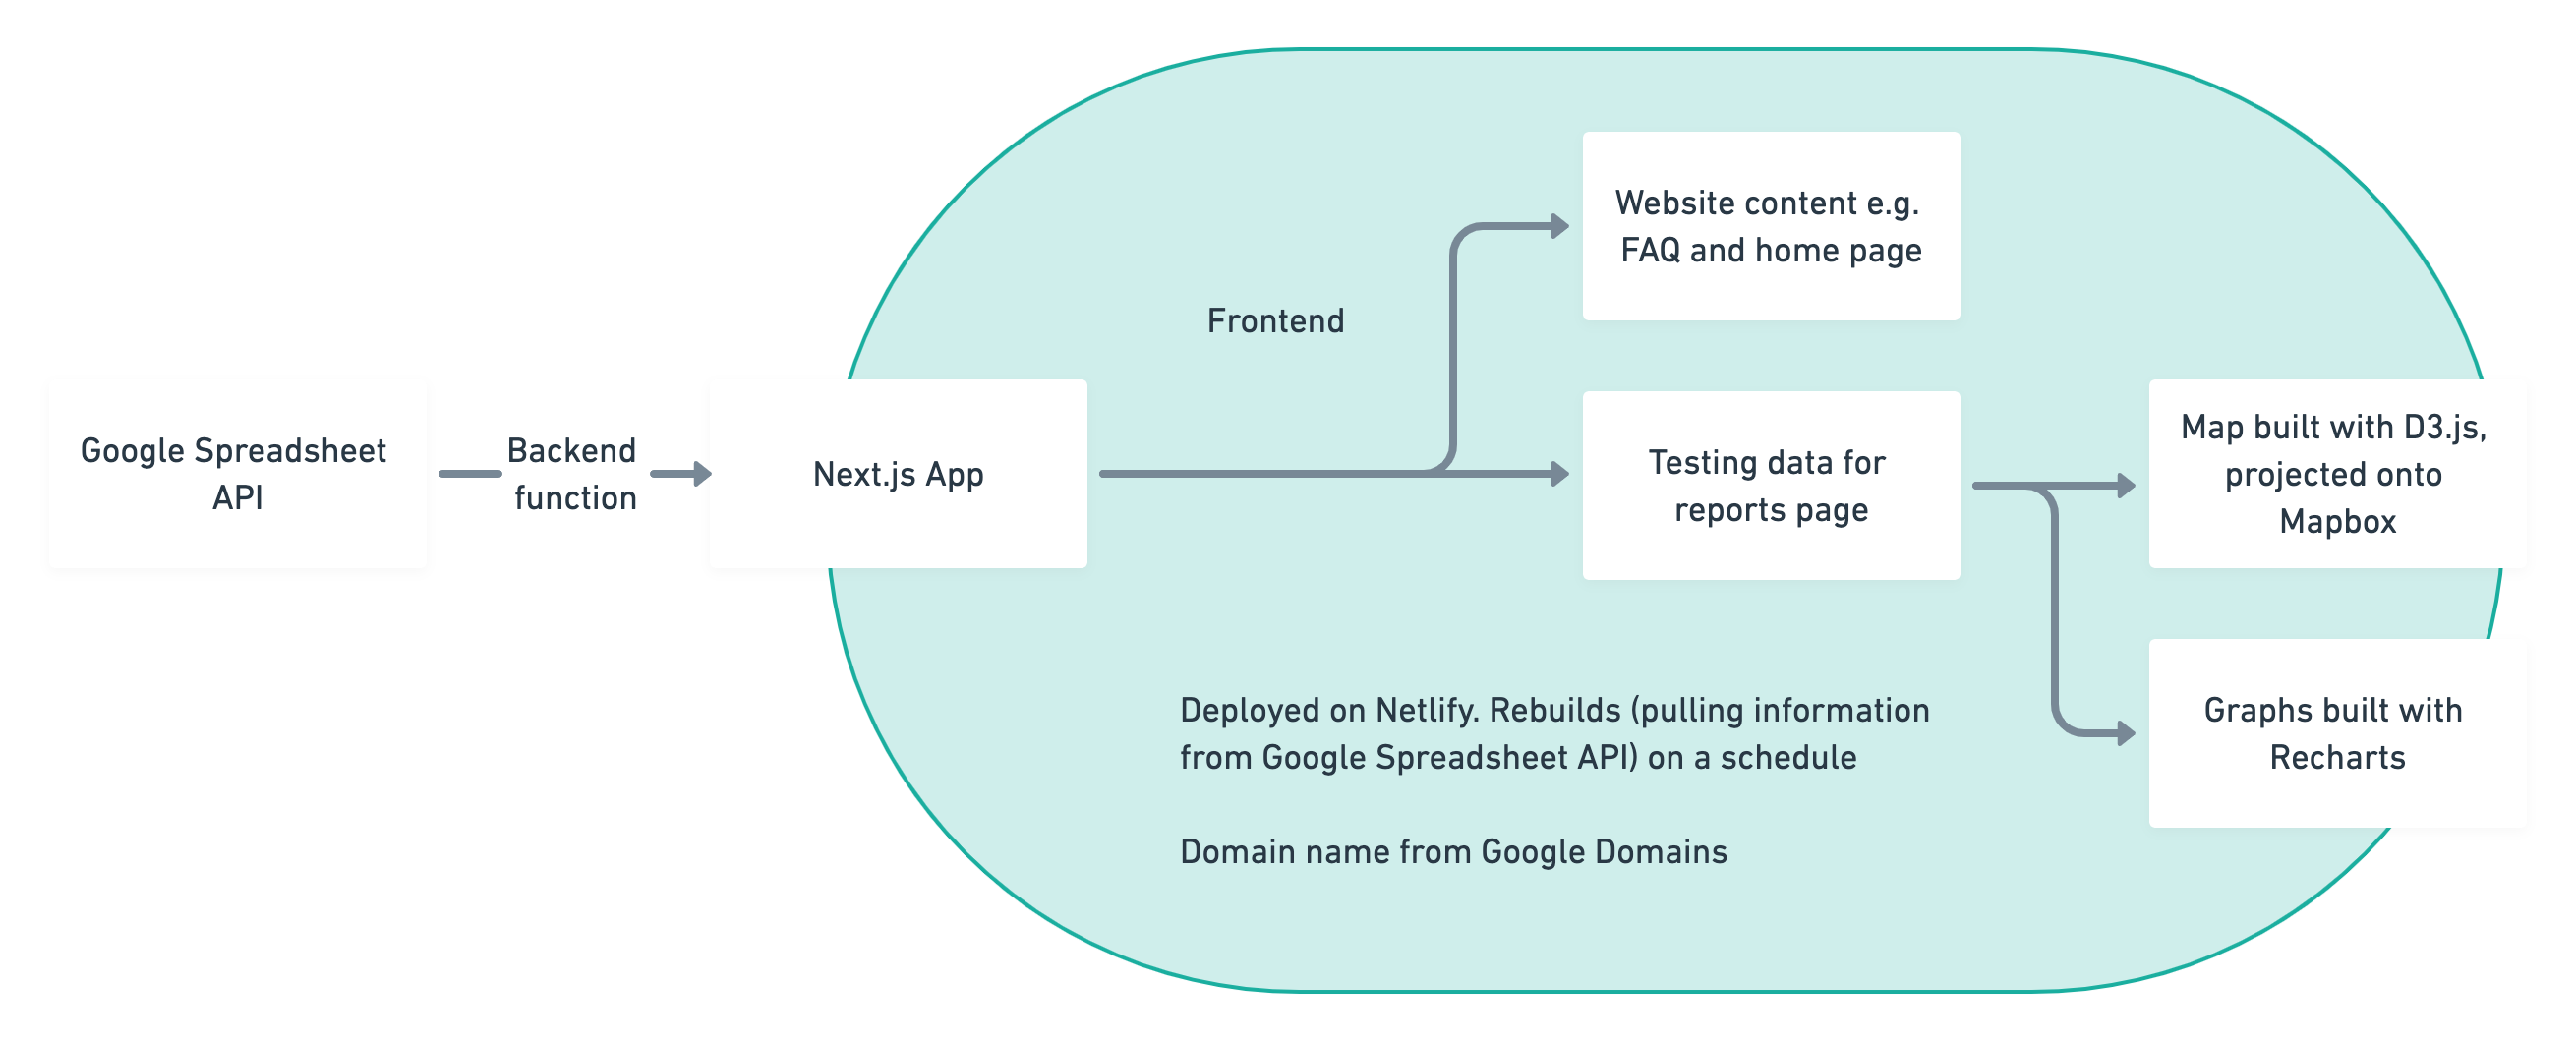
In brief, the website is a Next.js app. It queries the lab's RNA and case data on a Google Sheet, and uses it to construct graphs built with Recharts. Connecticut GeoJSON and D3.js are also used to create a map, which is projected onto Mapbox to make it interactive.
Querying data
One of my main takeaways from this project is that Google Sheets makes a suprisingly effective backend. While prototyping, I published the lab's Google Sheet to the web as a .csv and read it in using d3.csv in Next.js. I had to be careful about CORS though: when reading a public Google Sheet, you might have to use something like CORS Anywhere or set up your own intermediary.
Reading a spreadsheet like this is not performant, so eventually I had to sign up for the Sheets API in Google's Developer Console to access the lab's data. The official JS library docs are really dense, so I just used node-google-spreadsheet, a popular NPM package.
It turns out the Sheets API has a pretty small quota for requests. Funny story: the website crashed the day of release because we had lots of users and I had not researched the quota. I had to scramble for a fix. So it's a bad idea to query the Sheets API in real-time, even though the prospect of a live-updating visualization of COVID cases is tempting. Since the lab only adds new data twice a week, it was more realistic for me to fetch data on a schedule. Fortunately, Next.js has getStaticProps to fetch data at build-time, and paired with Netlify's build hooks and Github Actions, I am able to build the website every few hours or so (more precisely, every hour between 11 AM - 9 PM on weekdays ٩(^‿^)۶). No runtime data fetching also means no loading spinners  , which is another plus.
One last note is that Sheets also makes a simple but effective CMS. All the website content is extracted from the spreadsheet as key-value pairs and set in React using dangerouslySetInnerHTML.
TBD
I hope to flesh out this post more someday! Please check back to see more details of how I built the Wastewater Tracker (ノ ◕ ヮ ◕)ノ*:・゚ ✧
Press coverage
- Yale University Wastewater Tracker shows COVID outbreaks statewide (Fox 61)
- Website Provides Crucial Early Information on COVID Outbreaks (Yale School of Engineering & Applied Science)
- Yale researchers develop website monitoring COVID-19 spread using wastewater data (Yale Daily News)